From the coast to the foothills.
As part of National Science Week 2022, the City of Port Adelaide Enfield Libraries, with support from a National Science Week SA Community Grant, our IoT Experimenters Group began a Microclimate Citizen Science Project. Called “From the Coast to the Foothills”, it began leading up to and during Science Week and has become an ongoing program.
Our first goal was to develop an accessible open-source sensor in each of our five libraries to measure microclimates across the City of Port Adelaide Enfield from the coast to the foothills of Adelaide, South Australia. Libraries include Semaphore, Port Adelaide, Parks, Enfield, and Greenacres Library.

This project provides open access to data and information for the community about microclimates in each location a sensor is deployed, including temperature, humidity and CO2 levels. Accessible on our website here, providing live data trends and comparing them with other locations and other public information.
This includes open-source instructions for communities and schools on how to build similar sensors. We have encouraged any citizen scientists, community groups, experts, and interested people to be actively involved in further developing, deploying and monitoring these systems.
Accessible information about how microclimates affect our quality of life in urban and suburban areas is essential in a democracy. Communities better informed about science subjects can make better decisions and discuss solutions with friends, family and politics. We also feel communities who are better informed about their local area are more likely to appreciate the importance of protecting the environment, waterways, parks and natural spaces, including sustainable buildings, city planning and environmental protection regulations.
Why measure CO2 levels? While worldwide levels of CO2 are the primary driver of climate change worldwide the change over time is relatively small, be it significant to world climate. However, CO2 changes locally vary greatly and are an excellent indicator of pollution levels as it is produced in many manufacturing processes and whenever hydrocarbons are burnt, regardless of how well it is filtered. It also shows how well local weather changes disperse pollution.
More details about this project:
- Live microclimate data: https://stemlibrary.space/microclimate-data/
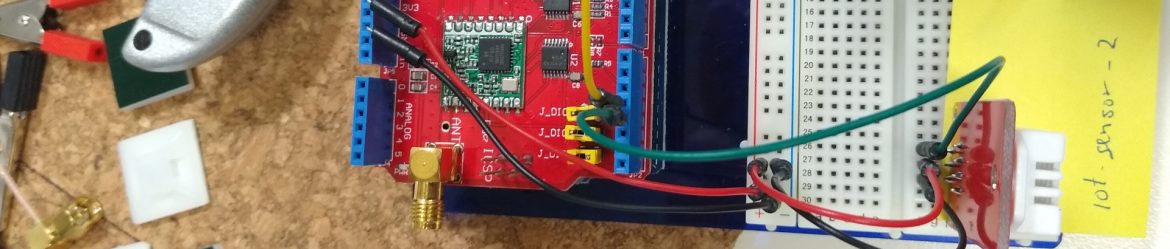
- Sensor construction: https://stemlibrary.space/microclimate-sensor/
- IoT overview: https://stemlibrary.space/iot-microclimate/
What are Microclimates?
A microclimate is a local set of atmospheric conditions that differ from the surrounding area, often with slight differences but sometimes substantially. The term may refer to areas as small as a few square meters or as large as many square kilometres. Microclimates can affect temperature, rainfall, air pressure, and wind. That means that it can increase the frequency of fog, the intensity of storms, the concentration of polluted air, and how long it remains.
Unintentional urban microclimates
Several factors go into creating unhealthy urban microclimates. Human-generated heat is a big part of it, which is caused by internal combustion car engines that use fossil fuels. Cars also add pollutants and humidity to the air. All of the heat-retaining paved space needed for cars makes matters worse.
Poor building construction and design also play a part, specifically wasteful energy consumption, shoddy insulating materials, and inefficient building management practices. And short-sighted urban planning of the height and arrangement of buildings can create stifling canyons of urban heat.
Undesirable urban microclimates are a global phenomenon. In Atlanta, the number of thunderstorms rises in line with increases in road traffic. In the 1950s, London’s naturally occurring fog became denser and more polluted by increased car traffic and coal-fired energy emissions.
The most-reported effect in the media has been urban heat islands (UHI). In Melbourne, temperatures increased to 1.13°C higher than in the surrounding less-urbanized areas. And average temperatures in Tokyo have risen by 3°C over the past century while only rising 1°C for the country as a whole. These higher temperatures then create a ripple effect on air movements. And they’re expensive: the UHI of Los Angeles generates additional energy costs of $100 million annually. Combining these with the significant impacts coming from climate change, communities must understand this problem and prepare, discuss and communicate their concerns to our political representatives.
More information about microclimates can be found here:
- https://en.wikipedia.org/wiki/Microclimate
- https://www.britannica.com/science/microclimate
- https://www.adaptwest.com.au/
We want to highlight that our community participants in the IoT Experimenters Group have created this Citizen Science project. We invite everyone to join us in this initiative, as we believe that crowdsourcing knowledge is an excellent way to foster transparency and collaboration. All the information we gather is available to anyone, free of charge. So, if you’re interested in contributing to this project or simply curious about it, please join us!